- 文章信息
- 作者: kaiwu
- 点击数:699
100+ Interesting Data Sets for Statistics
If we have data, let’s look at data. If all we have are opinions, let’s go with mine.
—Jim Barksdale
I’m not too fond of the phrase “information age.” It sounds like someone sat down and was like, “Hey, there’s a ton of information today… what should we call it? How about the information age?”
First of all, that’s just lazy and, second of all, it doesn’t capture how overwhelming it all is, the sort of angst and helplessness you feel when confronted with… everything. Just all of it.
A phrase that captures it a bit better is “drinking from the firehose.” I haven’t ever tried to drink from an actual firehose, but the metaphor certainly seems apt.
Maybe instead of information age, we could call it the saturation age, you know, because our brains are full to bursting. Or maybe just the overload age. Or how about the age of inundation?
One thing is certain, anyways. Some of us are drowning in data, most of us are oblivious, and some lucky few are surfing on it. We can do things that we couldn’t in the past (e.g. without Project Gutenberg, neither of my two analyses of the relationship between creativity and compression would have been possible.)
And that got me wondering: just what other interesting data sets are out there? As part of my research, I decided to put together this sort of guided tour, a curated list if you will — adding a bit of structure to the firehose’s deluge.
Here’s my attempt at making it all just a bit more manageable.
Interesting Data Sets
-
If, tomorrow, you get an email congratulating you on your new status as future Jeopardy contestant, how are you going to prepare? Well, one approach might be to download this archive of 216,930 past Jeopardy questions and plug them into your favorite spaced repetition system. Combine that with reading up on Jeopardy betting strategies, and you’re well on your way to becoming the next Arthur Chu (except hopefully nicer).
-
Ever get a morbid curiosity about what it’s like to be on death row? (Yeah, me neither.) But in case you ever have, Texas has graciously placed the last words of every inmate executed since 1984 online. So… sentiment analysis, anyone? (“How upbeat are death row inmates days before execution? With a little help from some data, we found out!”)
-
Speaking of prison, there’s more data on prisoners, including information about “their current offense and sentence, criminal history, family background and personal characteristics, prior drug and alcohol use and treatment programs, gun possession and use, and prison activities, programs, and services” available here.
-
How about reading other people’s emails? Ever wanted to do that, but can’t be bothered to train l33t hacking skills (and never mind the legality of it)? (Okay, this one I have thought about.) Well, I’ve got you covered. Check out the Enron corpus. It contains more than half a million emails from about 150 users, mostly senior management of Enron, organized into folders. Wikipedia calls it “unique in that it is one of the only publicly available mass collections of ‘real’ emails easily available for study.” Business idea: figure out what sort of information gets leaked in the emails that will later harm the execs at trial or whatever, then build a software system to automatically mine those out of real email. Either sell it to law enforcement or to corporate executives as the finest cover-your-ass email system.
-
Wondering what the internet really cares about? Well, I don’t know about that, but you could answer an easier question: What does Reddit care about? Someone has scraped the top 2.5 million Reddit posts and then placed them on GitHub. Now you can figure out (with data!) just how much Redditors love cats. Or how about a data backed equivalent of r/circlejerk? (The original use case was determining what domains are the most popular.)
-
Speaking of cats, here are 10,000 annotated images of cats. This ought to come in handy whenever I get around to training a robot to exterminate all non-cat lifeforms. (Or, if you’re Google, you could just train a cat recognition algorithm and then send those users cat-specific advertising.)
- If you’re interested in building financial algorithms or, really, just predicting arbitrage opportunities for one of America’s largest cash crops, check out this data set, which tracks the price of marijuana from September 2nd, 2010 until about the present.
-
The earliest recorded chess match dates back to the 10th century, played between a historian from Baghdad and a student. Since then, it’s become a tradition for moves to be recorded – especially if a game has some significance, like a showdown between two strong players. As a consequence, today, students of the game benefit from one of the richest data sets of any game or sport. Perhaps the best freely available data set of games is known as the “Million Base,” boasting some 2.2 million matches. You can download it here. I can imagine an app that calculates your chess fingerprint, letting you know what grandmaster your play is most similar to, or an analysis of how play style has changed over time.
-
On the topic of games, for soccer fans, I recently came across this freely available data set of soccer games, players, teams, goals, and more. If that’s not enough, you can grab even more data via this Soccermetrics API python wrapper. I imagine that this could come in handy for coaches attempting to get an edge over opponent teams and, more generally, for that cross-section between geeks and gamblers attempting to build analytic models to make better bets.
-
Google has put made all their Google Books n-gram data freely available. An n-gram is an n word phrase, and the data set includes 1-grams through 5-grams. The data set is “based originally on 5.2 million books published between 1500 and 2008.” I can imagine using it to determine the most overused, cliche phrases, and those phrases that are in danger of becoming cliched. (Quick! Someone register the domain clichealert.com!)
-
Amazon has a number of freely available data sets (although I think you need to run your analysis on top of their cloud, AWS), including more than 2.8 billion webpages courtesy Common Crawl. The possibilities are endless, but an old business idea I had: analyze the Common Crawl data and determine cheap or not-currently-registered domains which are, for whatever reason, linked to buy many websites. Buy these up and then resell them to people involved in SEO. (Or you could, you know, try to build the next Google.)
-
How well do minorities do on the computer science advanced placement exam? You can find out and tell me.
-
There’s the Million Song data set, which contains information about a million different songs, including a metric “danceability.” Might be nice to pair that with a media player specialized for parties — start with “conversation” music, and slowly shift to more danceable stuff as the night drags on. The data could also be used for a clustering algorithm (automatic genre detection, maybe), but I’m not sure how useful that’d be. A number of people have tried to build recommendation algorithms based on the data, including Kagglers and a team from Cornell. One possible use: analyzing music by year — How danceable, fast, etc. were the 70s? 80s? 90s? (Or how about looking for a follow-the-leader effect. If one song goes viral with a unique style, do a bunch of copycats follow?)
-
Speaking of music data sets, last.fm has music data available. Collected from ~360,000 users, it’s in the form of “user, artists, ## of plays”. This would be good for clustering algorithms that automatically determine label genre or recommender systems. (Even a “this artist is most similar to” thing would be sorta cool.)
-
When I think geeks, I think math and computer geeks, but there are many more. Terry Pratchett geeks (dated one!), Whovians, anime geeks, theater geeks and, with some relevance to this next data set, comic book geeks. Cesc Rosselló, Ricardo Alberich, and Joe Miro have put together a “social graph” of the Marvel Universe, and the data is freely available. Ideas for use: Maybe it could be overlaid on Facebook’s social graph to produce a new take on the “What superhero are you?” quiz.
-
Yelp has a freely available subset of their data, including restaurant rankings and reviews. One business idea: use tweets to predict restaurant star ratings. This would enable you to build out a Yelp competitor without requiring an active user base — you could just mine Twitter for data!
-
If you’re interested in data about data (metadata!), Jürgen Schwärzler, a statistician from Google’s public data team, has put together a list of the most frequently searched for data. The top 5 are school comparisons, unemployment, population, sales tax, and salaries. I was surprised that school comparisons were number 1 but, then again, I don’t have any brats running around (yet?). This list would be a good first step in researching what sort of data comparisons people actually care about.
-
Some of my readers are, no doubt, evil geniuses. Others want to save the world. There’s a subset of both of these groups who are interested in superintelligent robots. But to build such a robot, you’re going to have to teach it facts. All the things we take for granted, like that every person has one father. It would be a pain to insert those 10 million facts by hand (and, at a fact a minute, take more than 19 years). Thankfully, Freebase has done part of the job for you, making more than 1.9 billion facts freely available.
-
Maybe your plans are slightly less ambitious. You don’t want to build a superintelligent machine, just one smarter than your run of the mill mathematician. If that’s the case, you’re going to need to teach your machine a lot about mathematics, probably in the form of proofs and theorems. In that case, check out the Mizar project, which has formalized more than 9400 definitions and 49000 theorems.
-
And let’s say you build this mathematician and, sure, it can help you with proofs, but so what? You long for someone you can connect with on a deeper level. Someone who can summarize any topic imaginable. In that case, you might want to feed your robot on Wikipedia data. While all of Wikipedia is freely available, DBpedia is an attempt to synthesize it into a more structured format.
-
Now, you get tired of mathematics and Wikipedia. It turns out that proofs don’t pay the bills, so instead you decide to become a software engineer. Somehow, though, you’ve managed to build these machines without ever a rudimentary understanding of programming, and you want a machine that will teach it to you. But where to find the data for such a thing? You might start with downloading all 7.3 million StackOverflow questions. (Actually, all the StackExchange data is freely available, so you could feed it more math information from both MathOverflow and the other math stackexchange. Plus statistics from Cross Validated, and so on.)
-
Ever wanted to study true friendship? (C’mon! Free your inner
childsocial scientist.) Y’know, genuine, platonic love, like the kind embodied by dolphins? Well, now you can! All thanks to your humble author and Mark Newman, who’s placed a network of “frequent associations between 62 dolphins in a community living off Doubtful Sound, New Zealand.” Business idea: Flippr. It’s like Facebook, but for dolphins, with plans to expand into emerging whale and sea turtle markets. Most revenue will come from sardine sales. -
Do left-leaning blogs more often link to other left-leaning blogs than right-leaning ones? Well, I don’t know, but it sounds reasonable. And, thanks to permission from Lada Adamic, you can download her network of hyperlinks between weblogs on US politics, recorded in 2005. (Or you could just read her paper. Spoilers: conservatives more freely link to other conservatives than liberals link to liberals so, if you’re interested in link building, maybe you should register Republican.1
)
-
Who’s friendlier: the average jazz musician or the average dolphin? You could find out by combining the dolphin data set mentioned earlier with Pablo M. Gleiser and Leon Danon’s jazz musicians network data set.
-
What about 1930s southern women or prisoners? Who’s friendlier? How about fraternity members or HAM radio operators? All this and more can be figured out with these network data sets.
-
How about dolphins or Slashdotters?
-
Web 2.0 websites (like Reddit) are sometimes gamed by “voting rings,” which are groups of people that intentionally vote up each other’s content, regardless of quality. I’ve often wondered if the same thing happens in academic circles. Like, you know, one night during your first year in grad school, you’re kidnapped in the middle of the night and made to swear a blood oath that you’ll cite every other member of the club. Or something. Well, Stanford has put online Arxiv’s High Energy Physics paper citation network, so you could find out.
-
You read this blog, so you’re pretty smart, right? And maybe you’d like to be rich, you know, so you can found the next Bill and Melinda Gates Foundation and save the world. (Because that’s why you want to be rich, right?) Well, then maybe you ought to develop some new-fangled trading algorithm and pick up like a trillion pennies from in front of the metaphorical steam-roller that is the market. (Quantitative finance!) But, in such a case, you’d better at least test your strategy on historical market data. Market data which you can get here.
-
The Open Product Data website aims to make barcode data available for every brand for free. Business idea: a specialty tattoo parlor that only does barcode tattoos, but lets customers pick whatever product they want. Think about it: “What’s your tattoo mean?” “It’s a Twinkie barcode, because Twinkies last forever, man, just like my faith.”
-
The European Center for Medium-Range Weather Forecasts has an impressive looking collection of weather data. Why, you ask, does the weather matter? The economic incentives for predicting the weather are absurd. When should you plant crops? Plan a big event? Launch a space shuttle? Go deep sea fishing? But I want to talk about the most fun application of weather data I’m aware of: The financial industry. I have a lot of respect for finance, mostly because of the crazy stuff they do. The only practical application of neutrinos I’ve heard of, for instance, is “because finance.” Should your algorithm buy Indonesian sesame seed futures? With weather data, it might know.
-
If you need nutrition data about food, the USDA has you covered. Business idea: A phone application called, “Am I allergic to that?” Then, lobby for your state to pass some law regulating each school into buying a license of it for every student.
-
For a wordsmith, a good dictionary is indispensable, and when it comes to word data, you could do a lot worse than check out the freely available WordNet. WordNet has significant advantages over your run of the mill dictionary as it focuses on the structure of language, grouping words into “sets of cognitive synonyms (synsets), each expressing a distinct concept.” It also has some information about relationships, such as “a chair has legs.”
-
We’ve already established that some of you are evil geniuses, in which case, where are you going to build your secret lair? I mean, a volcano is pretty cool, but is it evil and genius enough for competing in today’s modern world? You know what the other evil geniuses don’t have? A secret base on a planet outside of the solar system. With NASA’s list, you can get busy commissioning someone to build you a base on KOI-3284.01.2
-
The Federal Railroad administration keeps a list of “railroad safety information including accidents and incidents, inventory and highway-rail crossing data.” Someone (like the NY Times) could overlay this on a map of the United States and figure out if people in poor regions are more likely to be hit by trains or something.
-
If you need a database of comprehensive book data, perhaps to build a competitor to Goodreads or an online digital library, the Open Library allows people to freely download their entire database.
-
Who is the United States killing with drones? If you’re content with Pakistan specific data, there is a list of drone strikes available here.
-
If you’re interested in building a Papers2 competitor with support for automatically importing citation data (please do this), CrossRef metadata search might be a good place to check out.
-
Mnemosyne is a virtual flash card program that takes advantage of spaced repetition to maximize learning. (As you might recall, I’m a big fan of spaced repetition.) The project has been collecting user data for years, and gwern has graciously agreed to freely host the data for a few months. Perhaps one could run some sort of unsupervised learning algorithm over it and try to discover heretofore unknown information about human memory.
-
How much would it cost to hire Justin Bieber to play at your wedding? The fine lads at Priceconomics have figured out how much it would cost to hire your favorite band. You could take this data and calculate some sort of popularity to price ratio — What’s the most fame for your buck?
-
I’ve mentioned in a few of the other data sets just how lucrative it is to be able to better predict the stock market than everyone else. In 2011, researchers found that they could use data from twitter to do just that: they went through tweets, found one’s related to publicly traded companies, and then calculated a mood score. With this they write, ” We find an accuracy of 86.7% in predicting the daily up and down changes in the closing values of the DJIA.” A number of Twitter data sets are freely available here.
-
A 2014 paper by Clifford Winston and Fred Mannering reports that vehicle traffic costs the United States 100 billion dollars each year.3 There’s money to be made, then, in routing traffic more efficiently. One way to do this would be to feed an algorithm historical traffic data and then use that to predict hotspots, which you would route people around. Lots of that data is available on data.gov.
-
On the other hand, if you were building an app to track current traffic data, you’ll need a different data source.
-
If you want to launch a spam-fighting service, or maybe just analyze what type of emails spammers are sending, you’ll need data. UC Irvine has you covered.
-
But maybe you want to extend your spam-fighting service to text messages. Still got you covered.
-
There is a wealth of data sets available for R and all you have to do is install a package. Ecdat is one of those packages, containing gobs of econometric data. How about an analysis of how math levels correlate with number of cigarettes smoked? I’d read that.
-
Ever wondered about how one person will be on the board of directors of several companies and it’s like, hey, maybe Condoleezza Rice with her ties to government surveillance isn’t the best choice for Dropbox? What if you could analyze those connections? Well, with this data set, you can. But only for Norway — it’s a network of the board members of public companies in Norway.
-
Ever seen a TV show where a government determines that someone is a terrorist based on their social ties? I always figured that data would be locked down tight somewhere, y’know, classified. But it turns out it isn’t. You, too, can analyze the social networks of terrorists.
-
There’s been a fair bit of controversy around all the bureaucracy of Wikipedia. But how does one become a bona fide Wikipedia big shot? Who’s the ideal Wikipedia administrator? Well, they’re voted for, and the data is available for download.
-
Harvard has opened up its set of “over 12 million bibliographic records for materials held by the Harvard Library, including books, journals, electronic resources, manuscripts, archival materials, scores, audio, video and other materials.”
-
If you need small data sets for students, check out DASL. One at random: does sterilizing dominant males in a wild mustang population reduce the population?
-
GET-Evidence has put up public genomes for download. I think Steven Pinker’s data is in there someone. Maybe you could make yourself a clone?
-
Oh, and speaking of genomes, the 1000 Genomes project has made ~260 terabytes of genome data downloadable.
-
In what is the smallest data set on this list, the survival rates of men and women on the Titanic. Female passengers were ~4x times more likely to survive than male passengers.
-
Want an super specific breakdown of the contents of your food? You’re in luck. (Thanks Canada!)
-
There’s a similar database of the metabolites in the human body. I’m not sure what you could do with it, but it might come in handy in some sort of dystopian future where humans are raised like cattle for their nutrients. (Maybe someone could use this to build a viral marketing campaign along the lines of, “How nutritious is your mom?”)
 * The Reference Energy Disaggregation Data Set has about 500 GB of compressed data on home energy use. Obvious use candidates: improving home efficiency or creating a visualization of just where people’s energy bills are going.
- Invented a new image compression algorithm (Pied Piper, anyone?) and need data to test it on? Look no further than the CSAIL’s tiny image data set.
-
Or maybe tiny images are too tiny. In that case, try the ImageNet database, which is structured around the WordNet hierarchy. So if you want to teach an algorithm what a narwhal looks like, this would be a good place to start. (This coming from someone who’s sister thought narwhals were mythical until the age of 18.)
-
Still not enough? How about all the Wikipedia images?
-
Let’s say you’re building the next generation of book reader, and you want to automatically associate phrases with the relevant Wikipedia article. How? Stanford in association with Google Research has you covered with their English-phrase-to-associated-Wikipedia-article database. The research paper can be downloaded here.
-
Yandex, the Russian search engine, has made a bunch of search data available. Namely, if someone searches for something, what do they click on? Downsides: It’s a Russian search engine with Russian search results.
-
Just what kind of edits do people usually make on Wikipedia? I don’t know, but you can figure it out with this data set.
-
Did you know that Google has a search engine for data sets?
-
Pew Research has many free data sets, including their “Global Attitudes Project” archive. Questions this data could answer: Is the world becoming more progressive over time? How have attitudes towards religion shifted over time?
-
Speaking of public attitudes over time, you can download a set of the General Social Survey from 1972 until about 2012, which should answer both of those questions.
-
There’s a fun math problem called the celebrity problem, which asks you to find the person who everyone knows, but who knows nobody. But what about the real life celebrity problem? Try Yahoo’s collection of celebrity faces.
-
Need a billion webpages from February 2009? Maybe to train a never ending language learner named NELL? Yup, it’s available.
-
Did you know that you can download all the PDFs on Arxiv? Once we manage to teach machines natural language, we can just have a computer read it all and give us the cliff notes (and the scientific breakthroughs).
-
If you need economic census data on any industry, check out census.gov’s industry statistics portal. If finance is really evil, you ought to be able to find something damning in the data.
-
For those unfamiliar with Usenet, it’s sort of like a huge, text-only forum. It was much more popular before the rise of the world wide web. Anyways, you can download a huge data set of postings to Usenet here. It might be pretty good for some kind of textual analysis project or training a machine learning algorithm (maybe a spellchecker?) You could use the data to build out a Google Groups competitor, too.
-
Nick Bostrom has a very interesting paper called “Existential Risk Prevention as Global Priority.” The basic intuition is that preventing even small risks of human extinction is worthwhile if we consider all the human generations it would save. One way to start saving all those future lives might be by digging into this data set of every recorded meteor impact on Earth from 2500 BCE to 2012.
-
How do gender and mental illness affect crime? This data set was collected explicitly with that question in mind.
-
Speaking of mental health, if you’re interested in how it affects minorities specifically, try this.
-
There are a lot of lonely men and women out there, and some of those lonely men and women have excellent analytical skills. For those lonely people, I suggest using this data set, which “surveyed how Americans met their spouses and romantic partners, and compared traditional to non-traditional couples” to determine the best way to meet that special someone.
- Tons of data on what is called “adolescent health” available here, but is actually more, including a bunch of relationship data and biomarkers. (Not creatine levels, unfortunately.)
-
Here’s a question: Are modern jobs worse than those of the past? My grandparents built tires at Firestone. Today, people rarely have that level of control and visceral experience of the finished product of their work. This set of five surveys regarding how different groups experience employment could answer that question. I can see the article now — “Is everything getting slightly worse? We found out.”
-
Stanford has 35 million Amazon reviews available for download. Lot’s of stuff you could do with this: use it to improve recommendation algorithms, figure out whether or not there’s a follow-the-leader effect with reviews (i.e. Do early positive reviews beget more positive reviews?)
-
Based on some of my research prior to writing this, the google keyword “data sets on serial killers” is 1) really specific and 2) weirdly popular, but I guess there’s no accounting for taste. And, of course, we’ve got data for that, thanks to the Serial Killer Information Center.4
-
In this gruesome vein, the University of Maryland has a “Global Terrorism Database,” which is a set of more than 113,000 terror incidents. You can download it after filling out a form. Ideas for use: visualization of terror incidents by location over time, predicting and preventing terror attacks, and creating early alert systems for vulnerable areas.
-
The MNIST Database is a classic in the field of machine learning. It’s a set of labeled hand-written characters, which are necessary for OCR algorithms. Today, some algorithms are actually more accurate than human judges! This would have been nice to have back when I was in grade school. I distinctly recall once arguing with a teacher over missing a question because she insisted that I had written the letter
jwhen it was clearly ad. In the future, we’ll let the machines decide. -
UCI has a poker hand data set available. My poker-fu is fairly weak, but I’m sure there’s some interesting analysis to be done there. I’ve heard second hand that humans still maintain some advantage over machines when it comes to poker, but I’m unable to verify that via Google. Machines have won in at least one tournament.
-
Another data set from UCI: images labeled as either advertisements or non-advertisements. This is good for building up classification algorithms that decide whether or not a new image is an ad or not, which might be good for, say, automatic ad blocking or spam detection. Or maybe a Google Glass application that filters out real life advertisements. That’d be cool. Look at a billboard and instead see a virtual extension of the natural landscape.
-
Remember the whole Star Wars Kid debacle? Wikipedia informs me that Attack of the Show rated it the number 1 viral video of all time. Andy Baio, one of the guys who was in on it before it was cool and coined the phrase “Star Wars Kid” has made his server logs from the time publicly available. Someone could take this data and produce a visualization of who saw it when via maps, along with annotations of where the traffic was coming from.
-
Who’s linking to who (and what) on WordPress? (Tidbit: most of the links to this site come from WordPress blogs.) With this WordPress crawl, you can find out. Visualizing the network might be sorta cool, but it’d be cooler still to uncover some information about “supernodes” that either are linked to often or put out a lot of links (or maybe both). Or maybe clustering people by interest.
-
Is Obama in bed with big oil? Or extremist environmentalists? Or the corn lobbies? And who was backing that Herman Cain dude, anyways? The 2012 Presidential Campaign Finance data is available for download. It would be neat to see an analysis of what industries prefer what candidates.
-
Cigarette data by state. Kentucky smokes the most, with West Virginia as a close second. Given the massive social harm of tobacco, a good analysis could very well save a lot of lives.
-
On December 5th of 2008, what was being downloaded from The Pirate Bay?
-
Want to build a Reddit recommendation engine? (Or, better yet, how about just a filter for the stupid-but-popular opinions?) Well, here’s the data a Redditor is using to do just that. The recommendation engine, I mean.
-
Global health data. This would be great for identifying high-impact ways to improve world health, like the Schistosomiasis Control Initiative, which is one of GiveWell’s top rated charities.
-
United States crime from 1960 to 2012. I’d like to see a graph of rape per capita over time (which, from a brief peek at the data, is dropping.) And then add the data for prison rape, which is morally repugnant but apparently a-okay to joke about on television.
-
How about launching a Yelp-for-bathrooms?
-
Did you know that the best-selling item in Canadian grocery stores is Kraft Dinner (aka macaroni and cheese)? I wonder how it sells in Belgium or Taiwan. Here’s some supermarket data from there.
-
Data on usage of the Firefox web browser. Records things like number of tabs used, time active, number of private tabs opened. While that last point might allow for some titillating finds (private browsing is for porn!), it might be neat to see how accurate self-reports of time on internet compare to the actual data.
-
This one is super cool: Mozilla has put together a data set of the more than 200,000 bugs found in Mozilla and Eclipse. I would love to see a breakdown of what bugs are the most common and how they can be prevented. Software solutions would be worth a lot of money. Programming languages could be designed around them.
-
If you’re interested in the design of scheduling algorithms (I am!), Google has released a data set of the sort of jobs that they’re running on their clusters. Developing algorithms against this data set might help future proof your discoveries. After all, tomorrow’s desktop might look a lot like today’s data center.
-
Techcrunch released a data set with more than 400,000 company, investor, and entrepreneur profiles, along with an additional 45,000 investment rounds. This might be a good way to reverse engineer what the market’s looking for and what investors are funding.
-
Where are the United States’s major military installations located?
-
Who receives H1-B visas? Might be interesting to know if some countries are more likely to get into the program or which companies “consume” the majority of the visas.
-
The Twitter users most likely to be followed by users of Hacker News.
-
Here’s all the earthquakes between 1000 and 1903. Feeding them to a neural net and seeing what kind of predictions you get out might be neat. (And, hey, if you develop something better than the status quo, you can sell it and save lives!)
-
I’ve often wondered if the people who take personality tests online are more neurotic than the population at large. There’s a lot of data from a series of online personality tests available here, so you could compare their answers to those from the population at large, find out, and then send me an email.
-
And, finally, something I would have loved as a kid: the list to end all lists of naughty words.
Further Reading
-
If you’re interested in building predictive models, Max Kuhn’s Applied Predictive Modeling is awesome and I highly recommend it. If you’re interested in visualizations, I’ve heard good things about Tufte’s The Visual Display of Quantitative Information, but I haven’t read it myself. (Edit: Commenter DivM recommends Visualize This and The Functional Art over Tufte.)
-
I’ve written two posts that use Project Gutenberg data to examine the link between creativity and compression.
-
For building visualizations, Excel 2013 has a new “Power Map” feature, which looks dead simple.
Footnotes
- With apologies to JFK: “Let us seek not the Democrat link or the Republican link, but the right link.”
- Wikipedia says: “KOI-3284.01 is believed to be the most Earth like exoplanet to be found so far by the Kepler space probe. It is predicted to have a radius 1.5 times that of Earth’s. It is predicted to be located at the proper distance from the sun to sustain liquid water.”
- “The Texas Transportation Institute’s latest Urban Mobility Report puts the annual cost of congestion to the nation, including both travel delays and expenditures on fuel, at more than $100 billion.”
- If that’s not enough, there seems to be a fair amount of research around “murder topology” which is not, as you might naively expect, a super badass branch of mathematics, but rather concerned with the movement patterns of serial killers.
- 文章信息
- 作者: kaiwu
- 点击数:706
- Cite a dataset produced by the COVID-NMA initiative by using this format:
Thu Van Nguyen, Gabriel Ferrand, Sarah Cohen-Boulakia, Ruben Martinez, Philipp Kapp, Emmanuel Coquery, … for the COVID-NMA consortium. (2020). RCT studies on preventive measures and treatments for COVID-19 [Data set]. Zenodo. http://doi.org/10.5281/zenodo.4266528 - Cite a visualization developed by the COVID-NMA initiative by using this format:
Data: Thu Van Nguyen, Gabriel Ferrand, Sarah Cohen-Boulakia, Ruben Martinez, Philipp Kapp, Emmanuel Coquery, … for the COVID-NMA consortium. (2020). RCT studies on preventive measures and treatments for COVID-19 [Data set]. Zenodo. http://doi.org/10.5281/zenodo.4266528
Visualizations: Romain Vuillemot - LIRIS, École Centrale de Lyon; Philippe Rivière - LIRIS, VisionsCarto; Pierre Ripoll - LIRIS, INSA Lyon; Julien Barnier - Centre Max Weber, CNRS.
Retrieved from: ‘https://covid-nma.com/dataviz/’ [Online Resource]
https://covid-nma.com/dataviz/
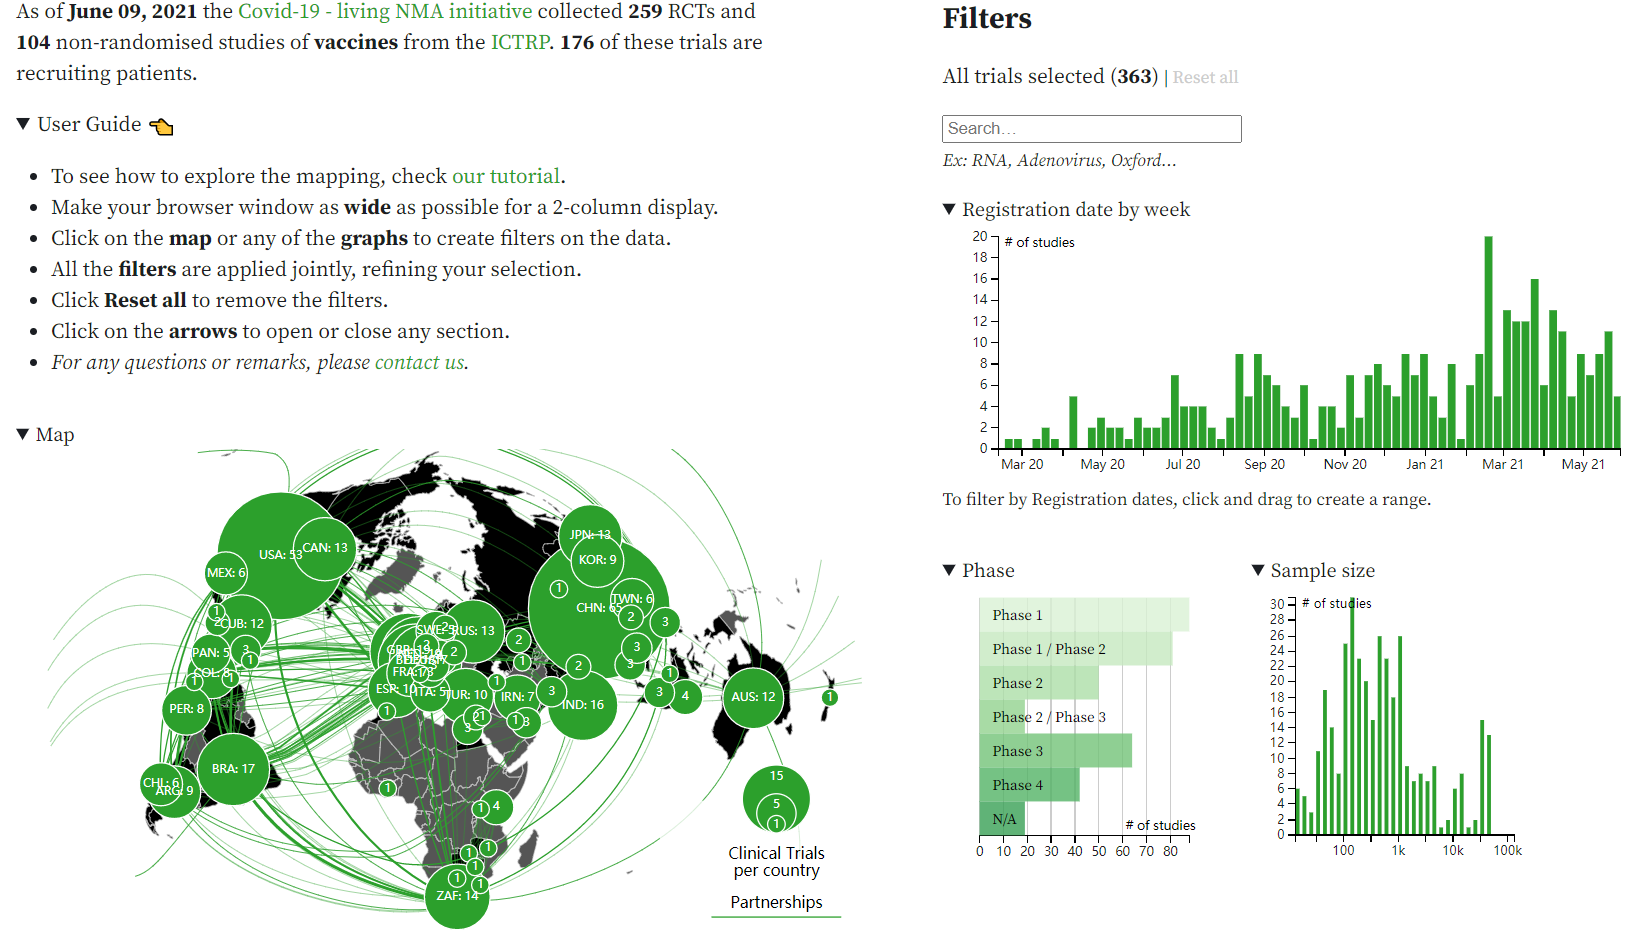
https://covid-nma.com/vaccines/mapping/
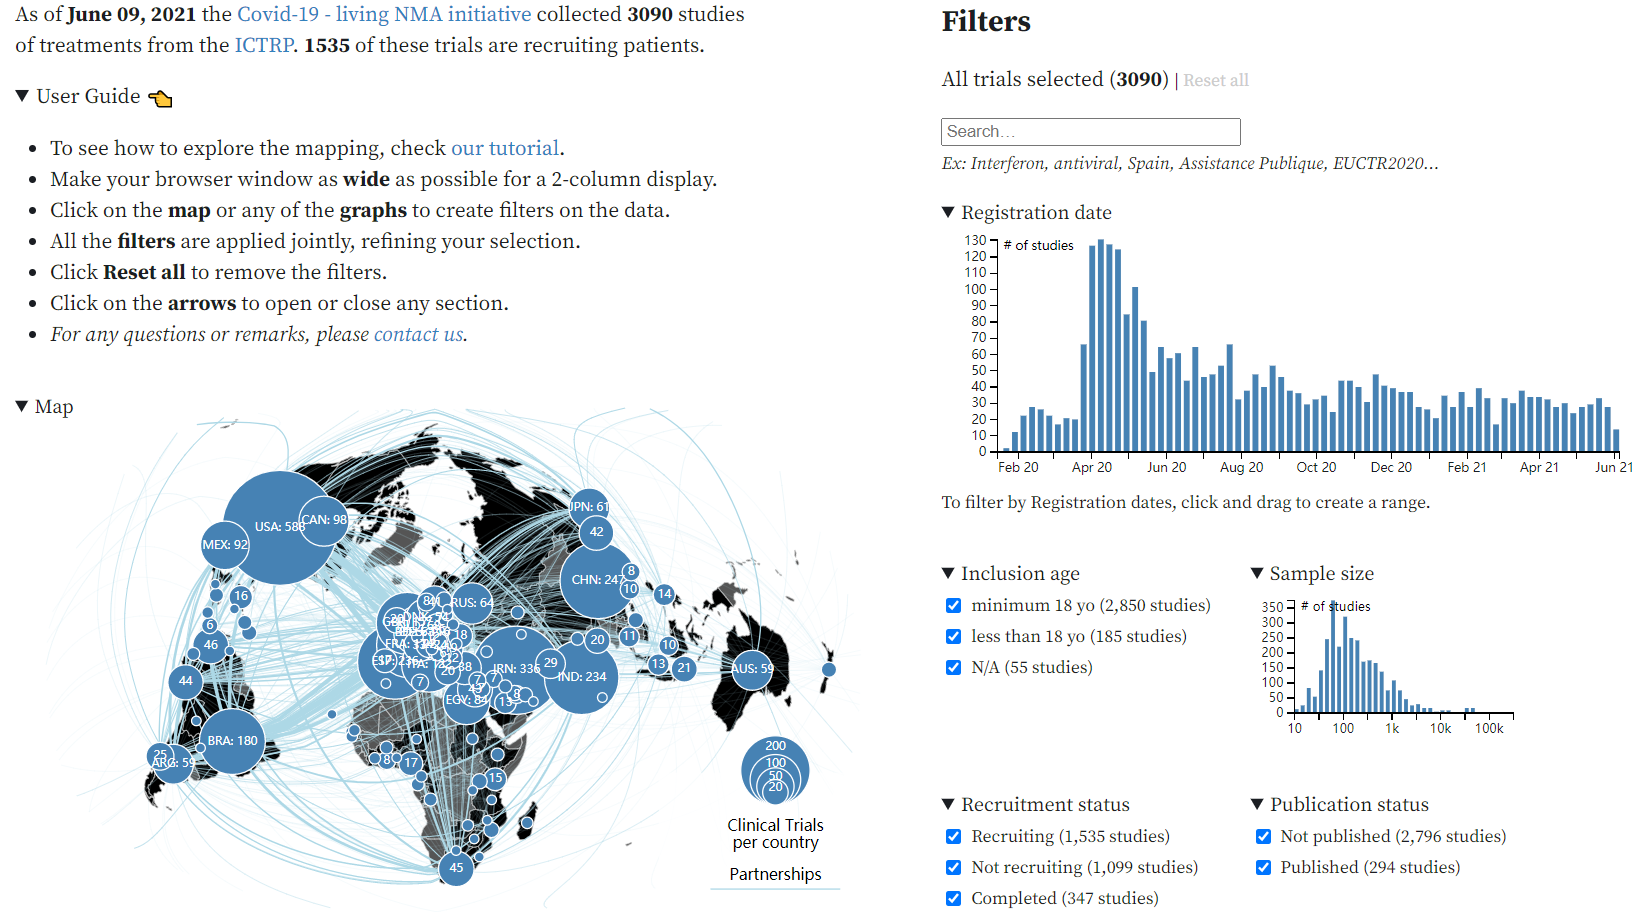
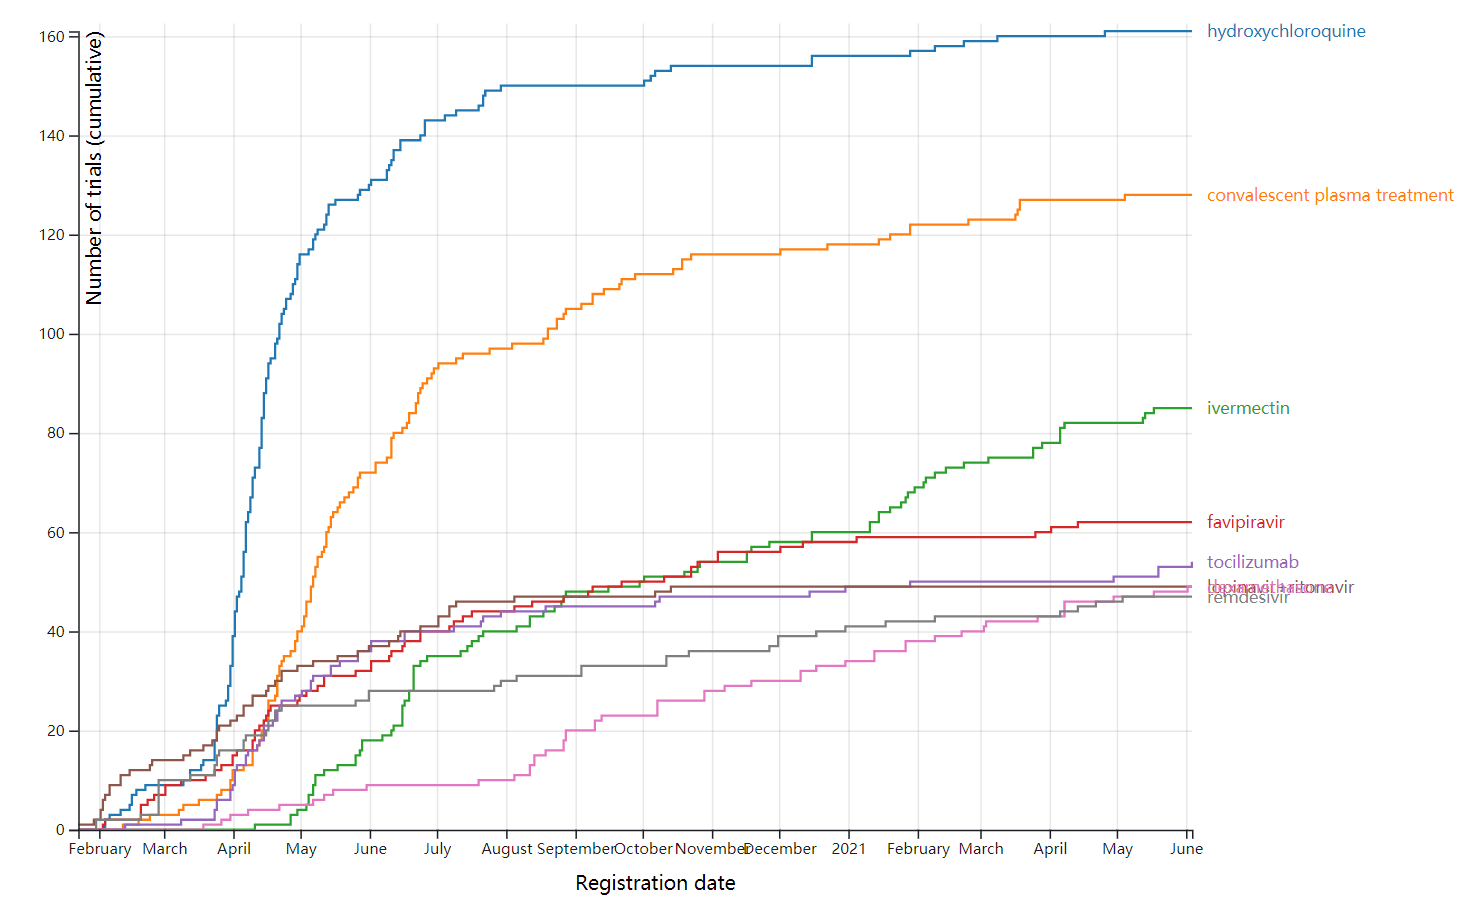
https://covid-nma.com/treatments_tested/
https://ncov.dxy.cn/ncovh5/view/pneumonia?from=timeline
https://www.healthmap.org/covid-19/
https://who.maps.arcgis.com/apps/opsdashboard/index.html#/c88e37cfc43b4ed3baf977d77e4a0667
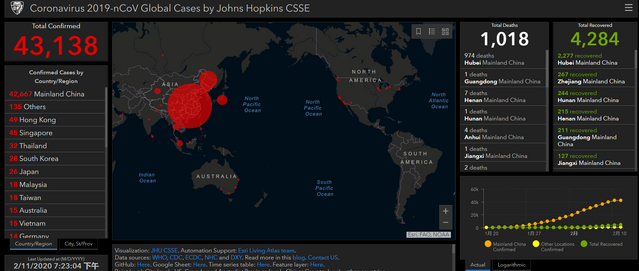
1.Johns Hopkins University
Johns Hopkins University
The Center for Systems Science and Engineering (CSSE) at Johns Hopkins University(JHU)
Visualization:JHU CSSE.
Automation Support:Esri Living Atlas team.
Read more in thisblog.
Data sources:WHO,CDC,ECDC, NHC andDXY.
Downloadable Google Sheet (new link):Here. Time series table:Here. Feature service:Here.
Point level: City level - US, Canada and Australia; Province level - China; Country level - other countries.
maps
https://gisanddata.maps.arcgis.com/apps/opsdashboard/index.html#/bda7594740fd40299423467b48e9ecf6
http://www.arcgis.com/apps/opsdashboard/index.html#/85320e2ea5424dfaaa75ae62e5c06e61
https://systems.jhu.edu/research/public-health/ncov-model-2/
2.Git hub
https://github.com/CSSEGISandData/COVID-19
https://github.com/search?q=ncov+2019(715)
https://github.com/shfshanyue/2019-ncov
https://github.com/BlankerL/DXY-COVID-19-Crawler
3.kaggle
The goal of this page is to bring together the most useful contributions from the Kaggle community's COVID-19 work into a single place. It is organized into literature review, tools and datasets.
https://www.kaggle.com/allen-institute-for-ai/CORD-19-research-challenge
https://www.kaggle.com/covid-19-contributions
https://www.kaggle.com/search?q=2019+ncov(257)
https://www.kaggle.com/paultimothymooney/coronavirus-genome-sequence/discussion/132982#latest-759834
https://www.kaggle.com/sudalairajkumar/novel-corona-virus-2019-dataset
4.tableau
https://public.tableau.com/zh-cn/search/all/ncov(161)
https://public.tableau.com/profile/dennis199441#!/vizhome/2019-nCoVMap/2019-nCoVMap
5.mathematica
https://community.wolfram.com/groups/-/m/t/1872608?source=frontpage-latest-news
- 文章信息
- 作者: kaiwu
- 点击数:3312
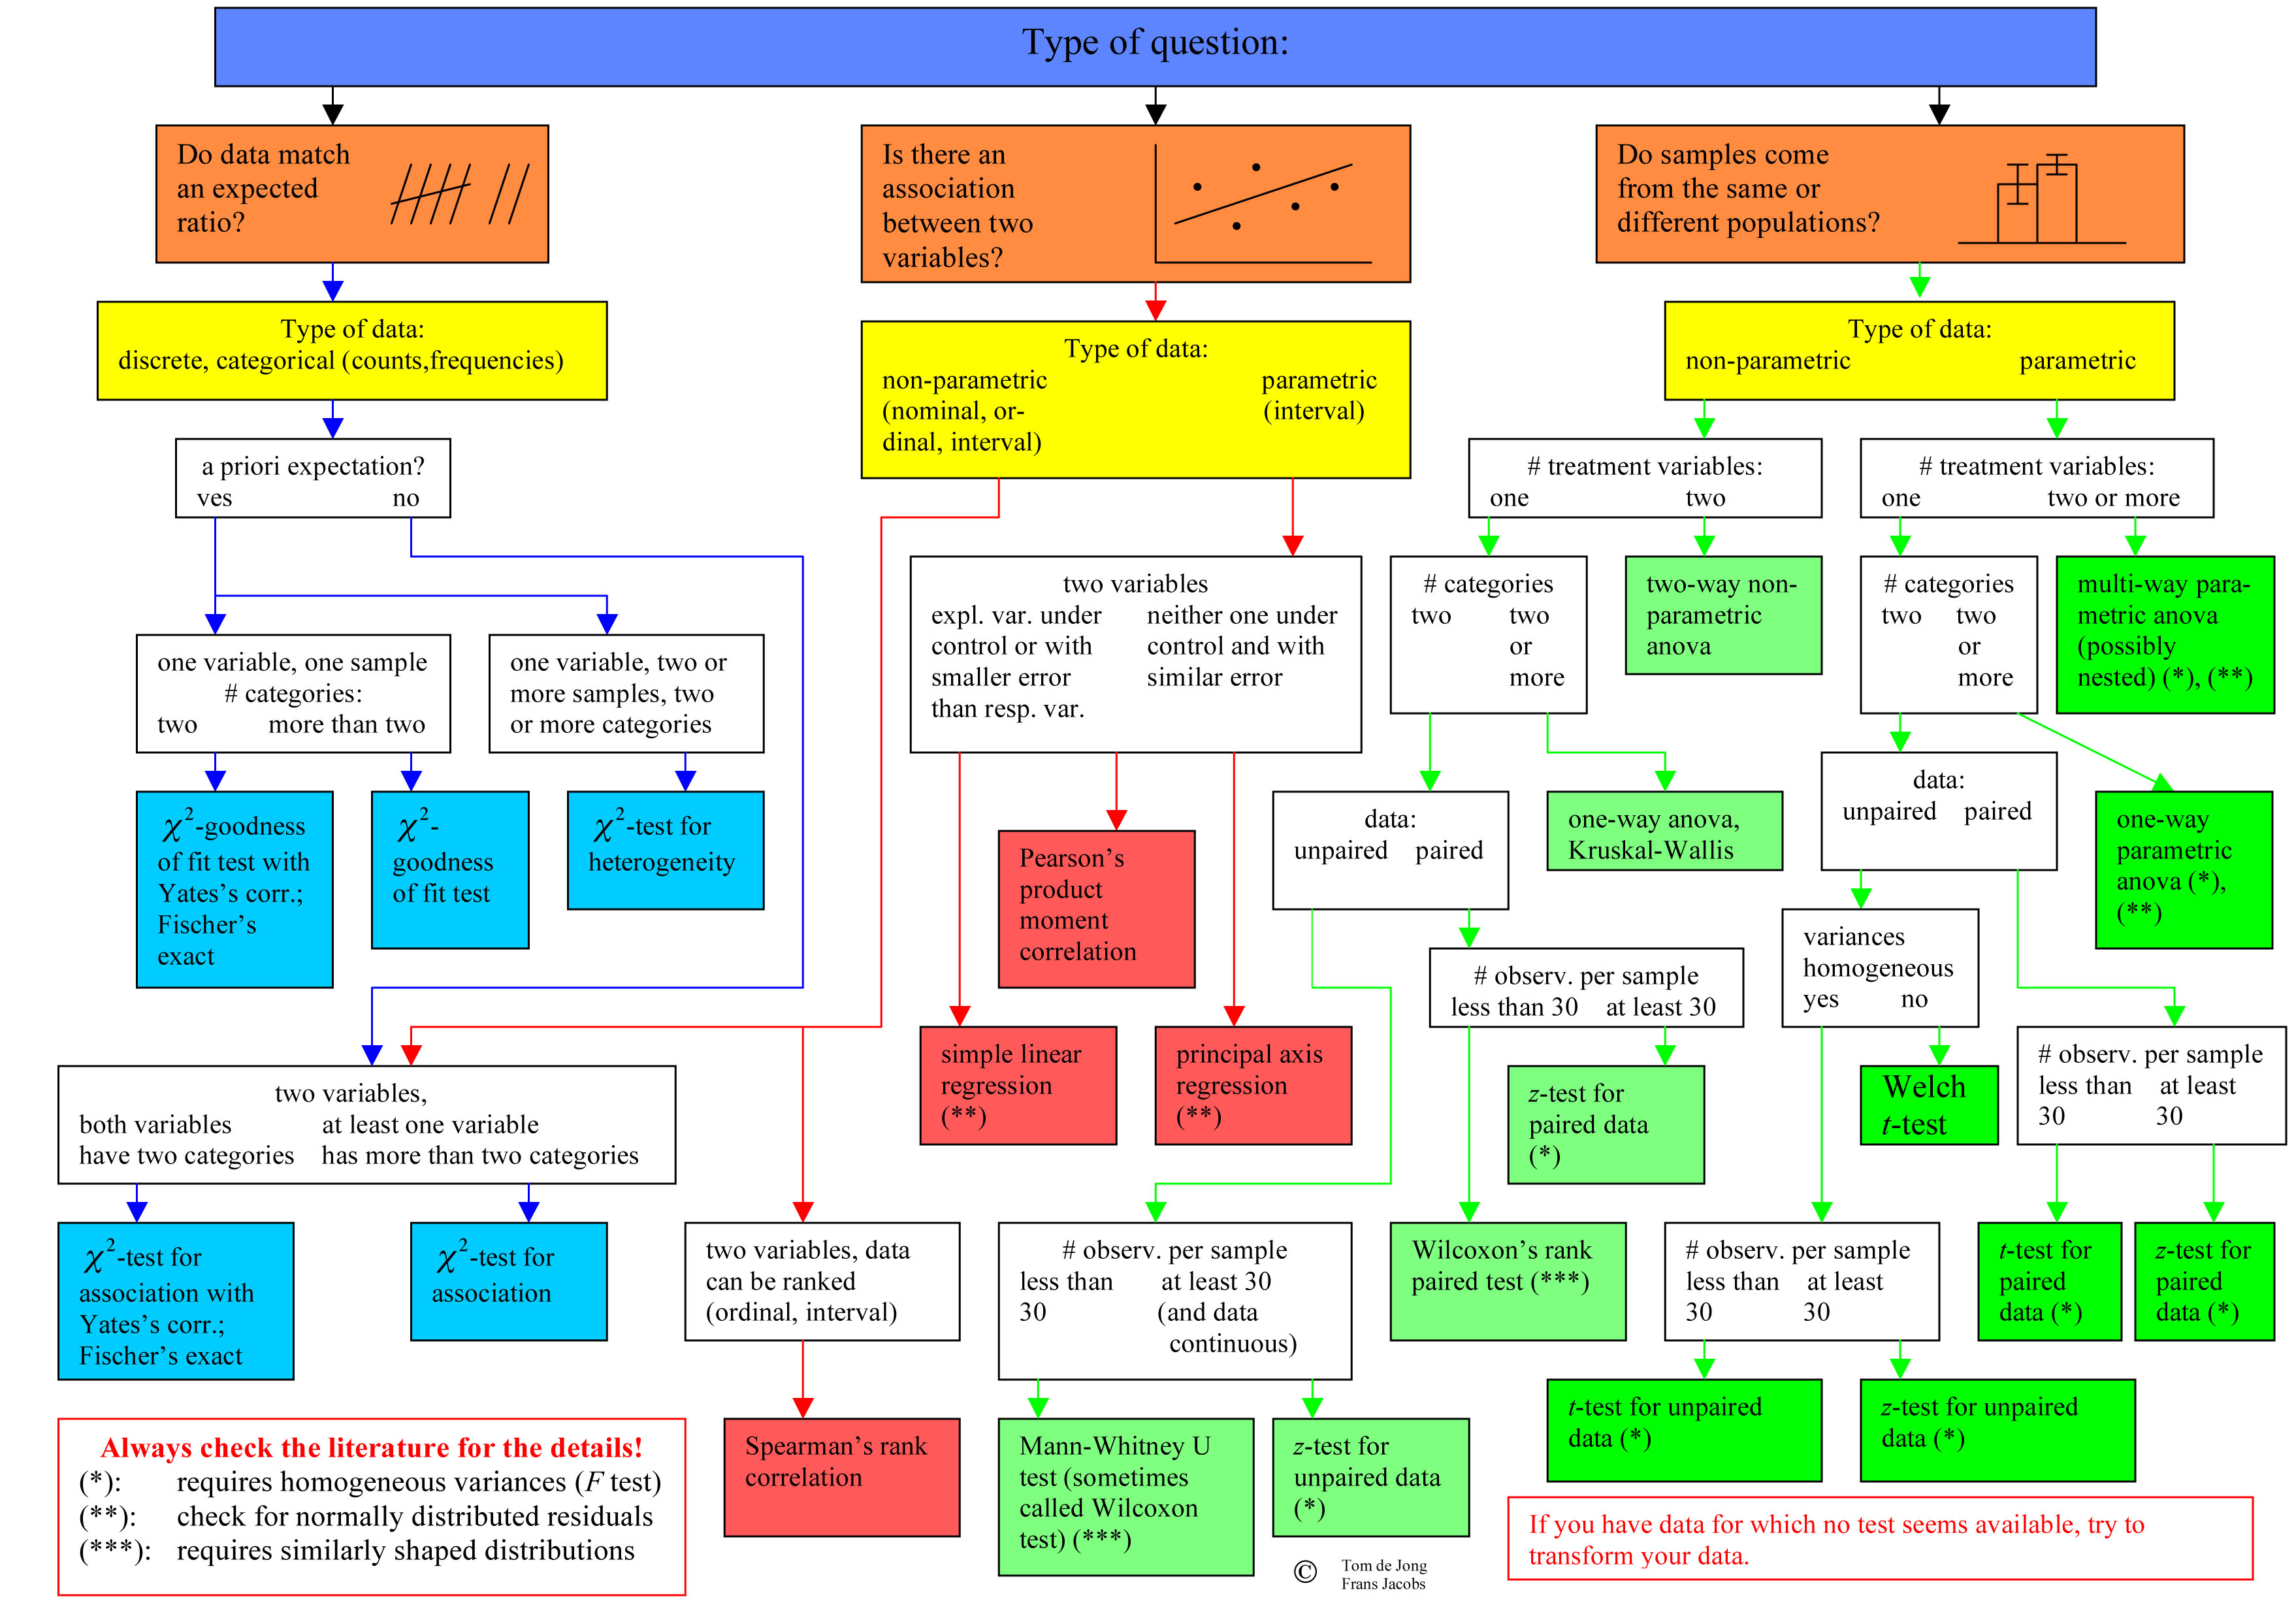
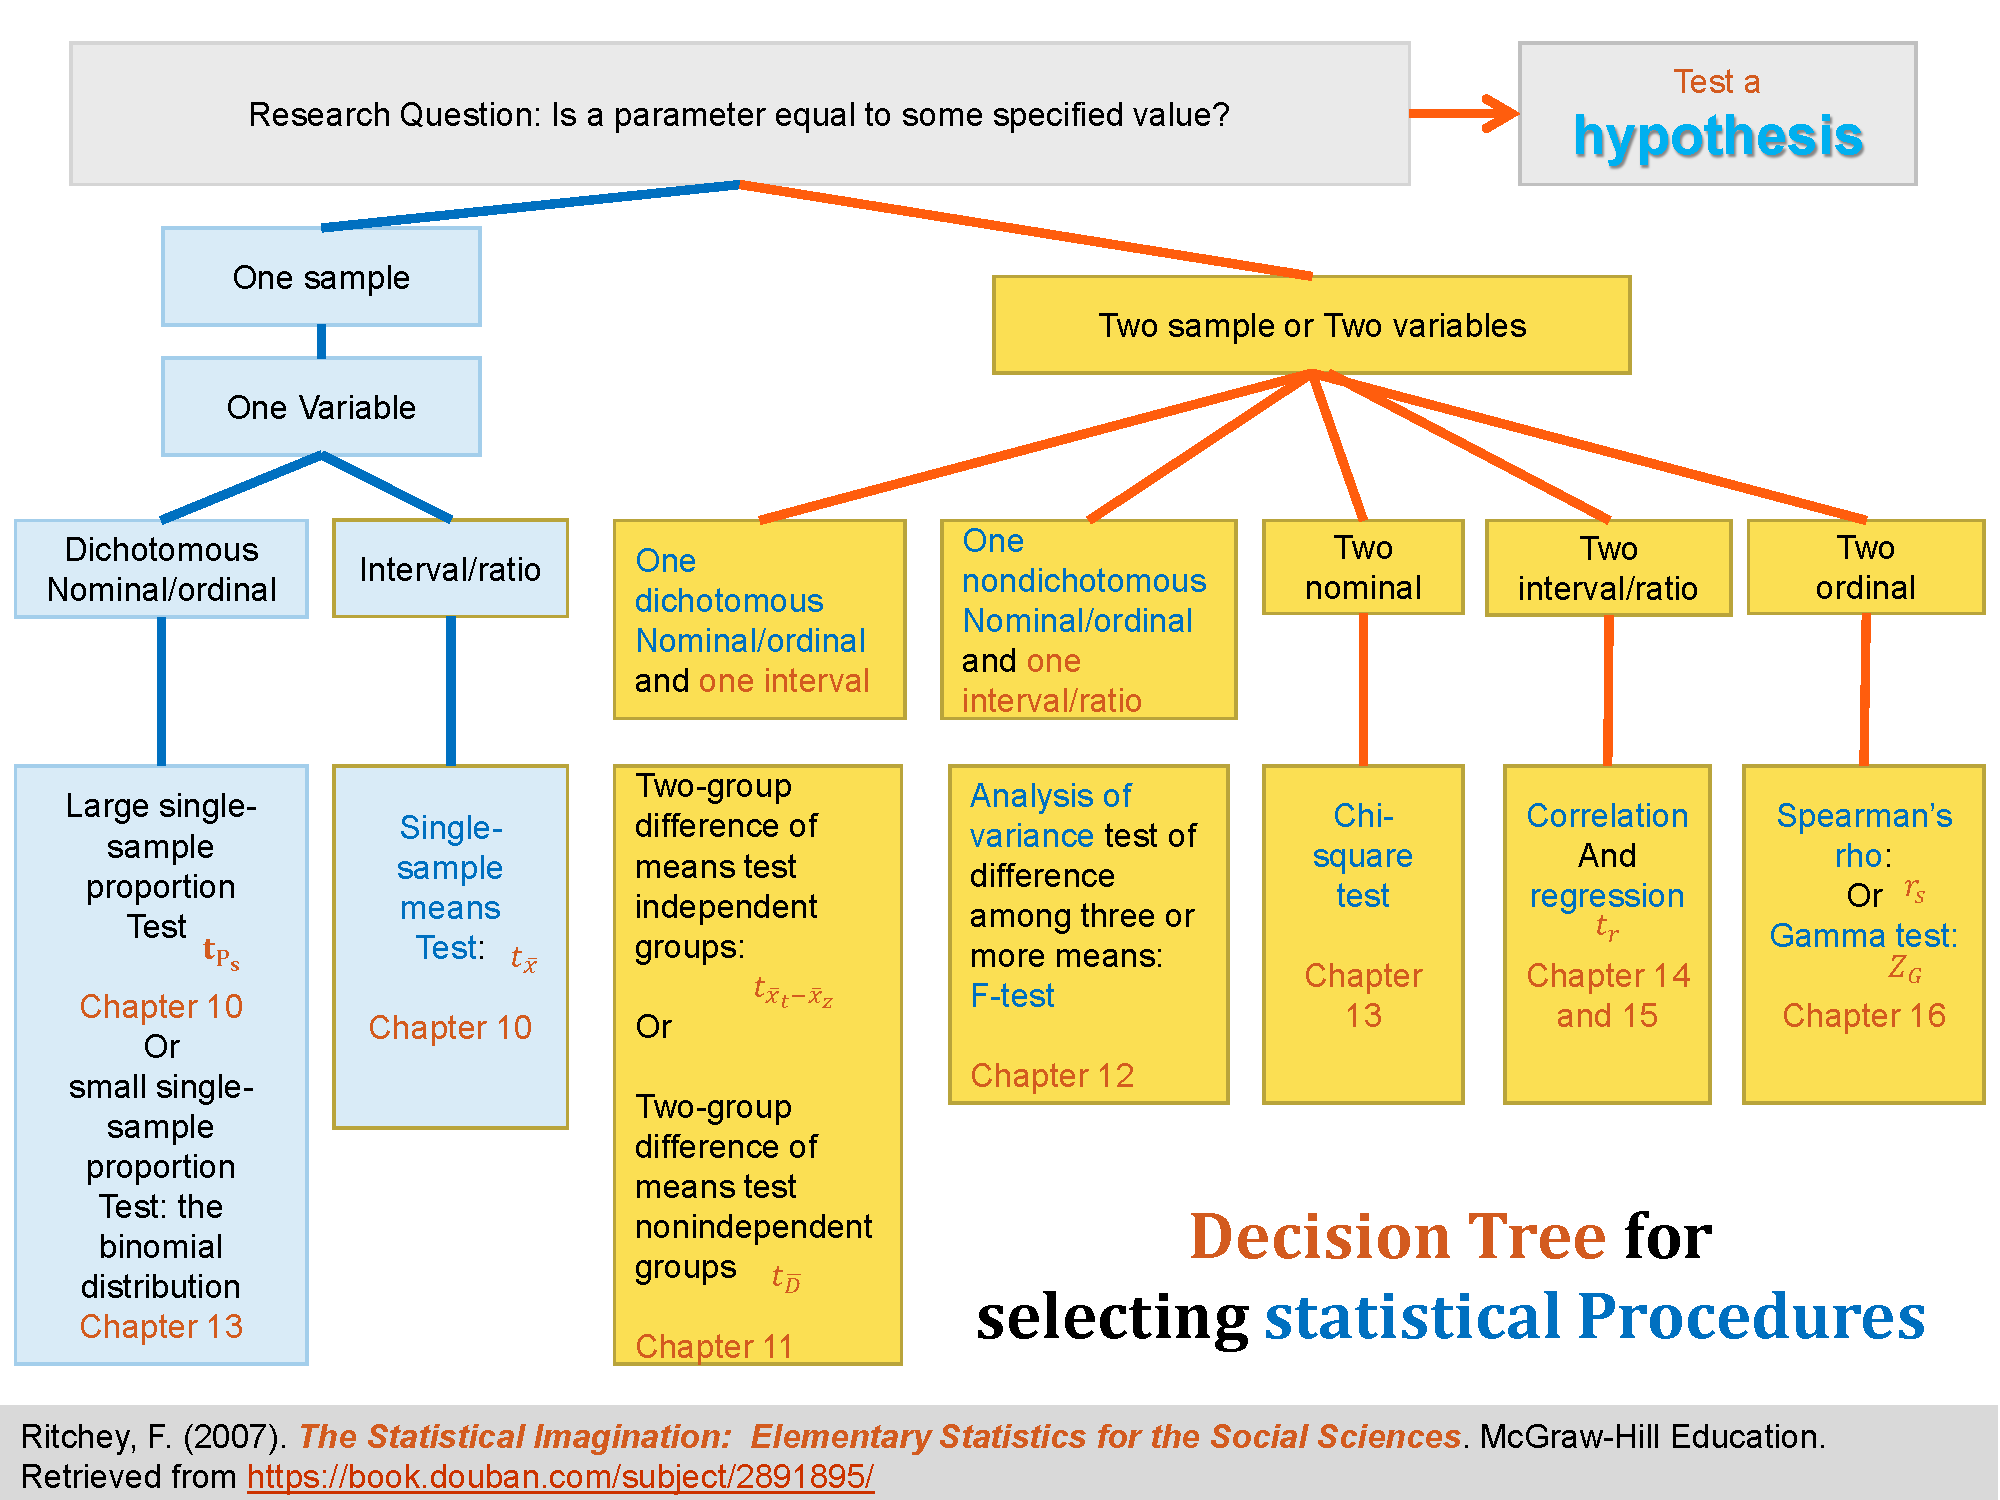
1.Decision Tree for selecting statistical Procedures
Ritchey, F. (2007). The Statistical Imagination: Elementary Statistics for the Social Sciences. McGraw-Hill Education. Retrieved from https://book.douban.com/subject/2891895/

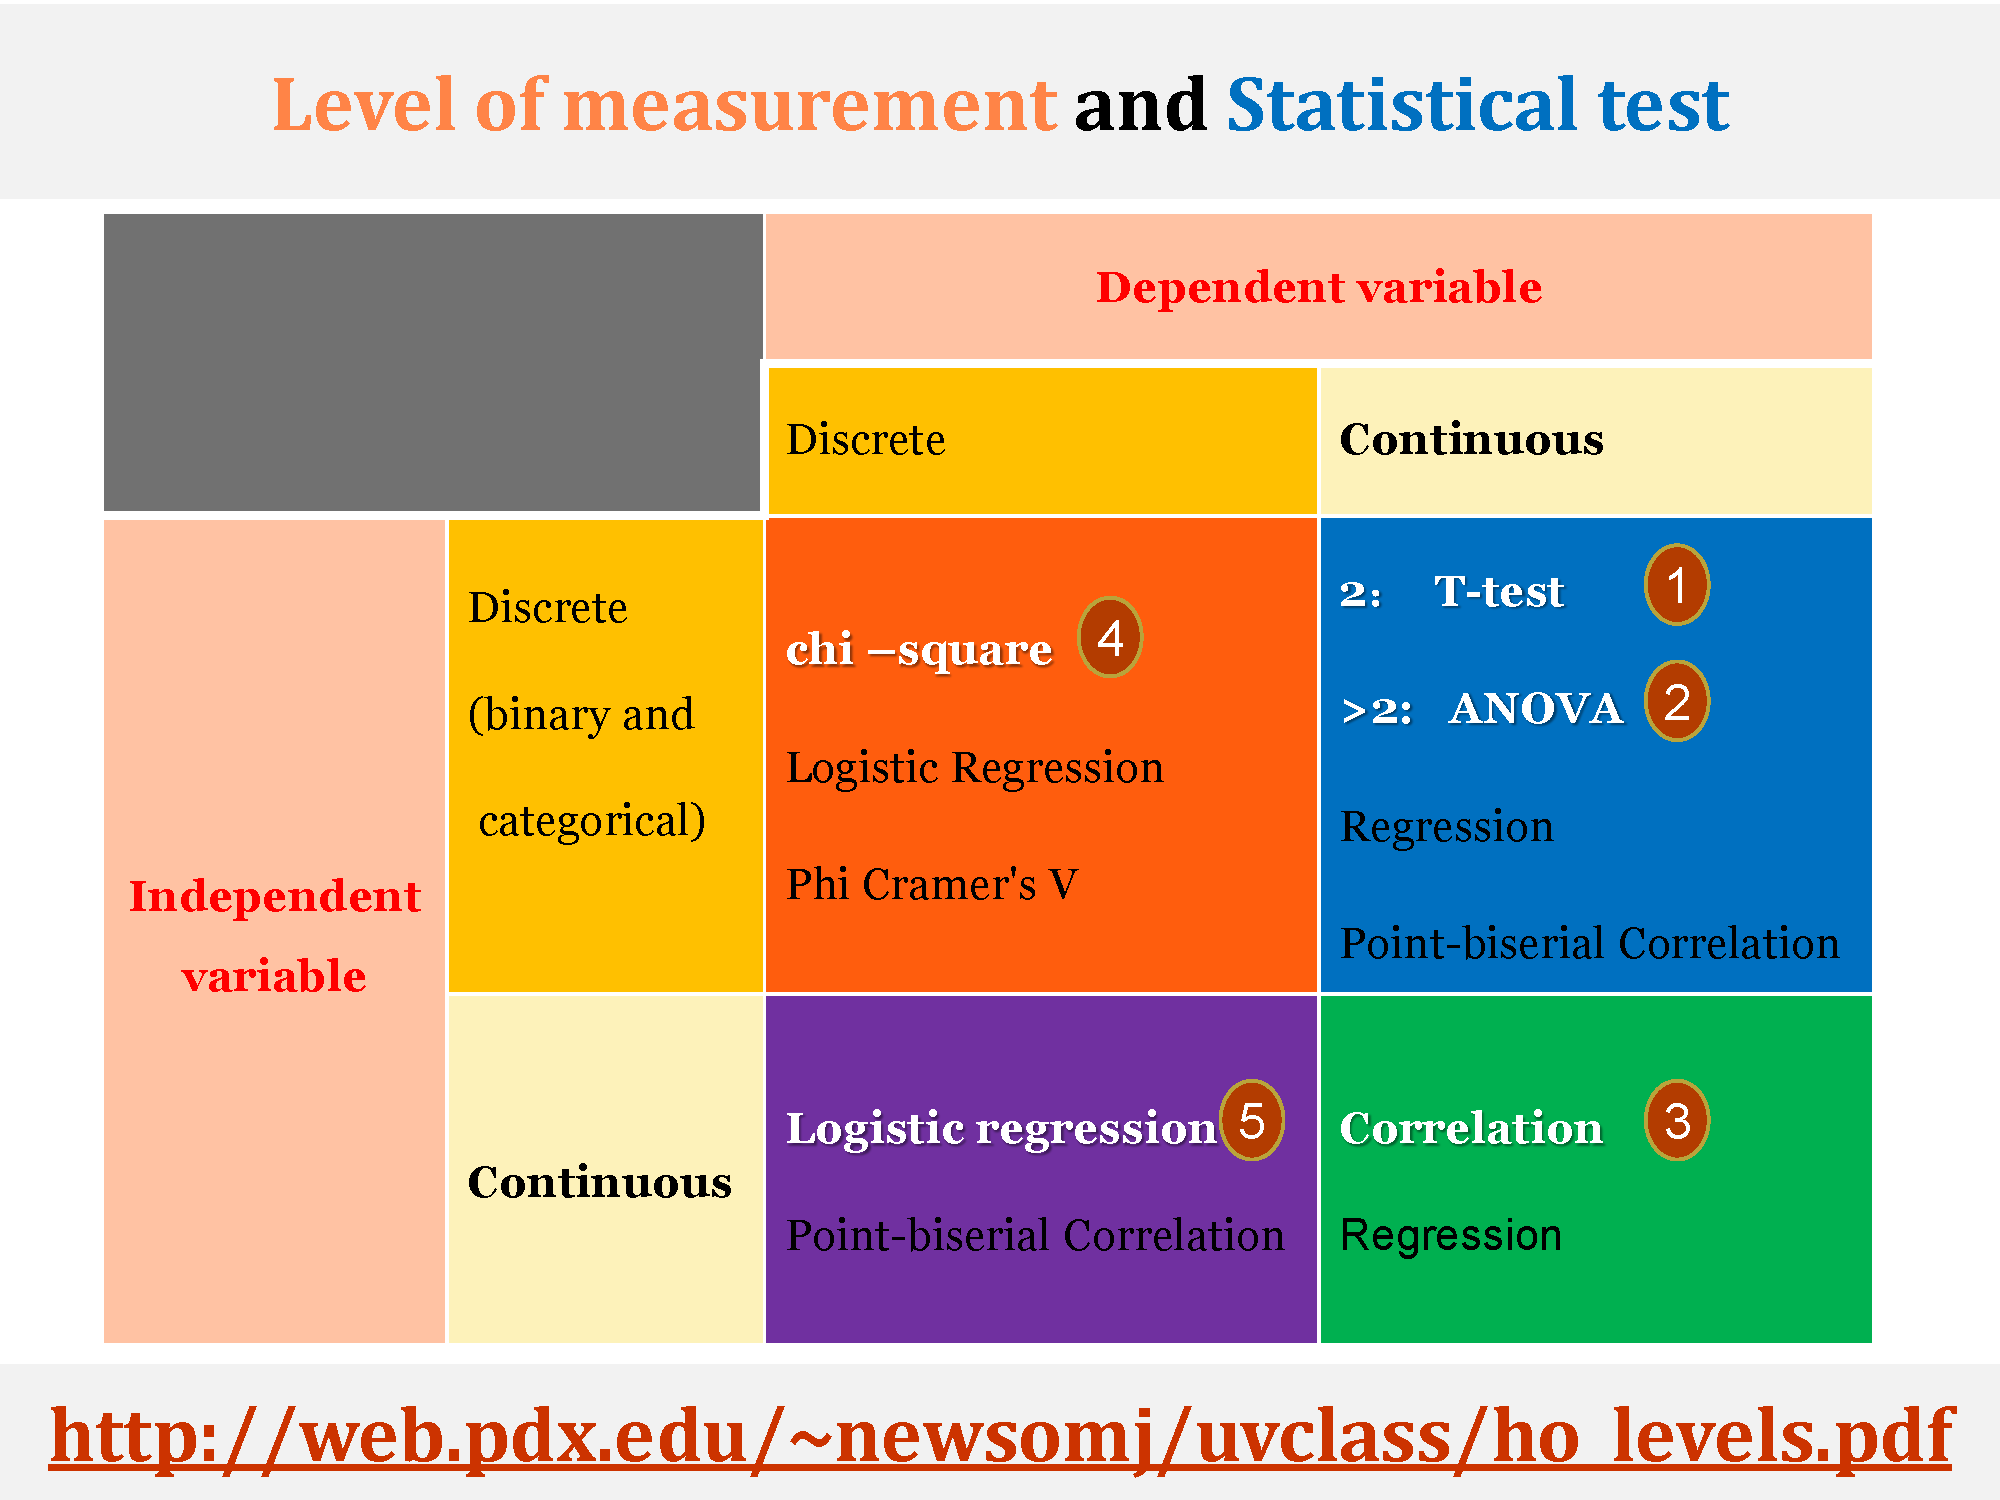
2.Levels of Measurement and Statistical Test
Levels of Measurement and Choosing the Correct Statistical Test
http://web.pdx.edu/~newsomj/uvclass/ho_levels.pdf
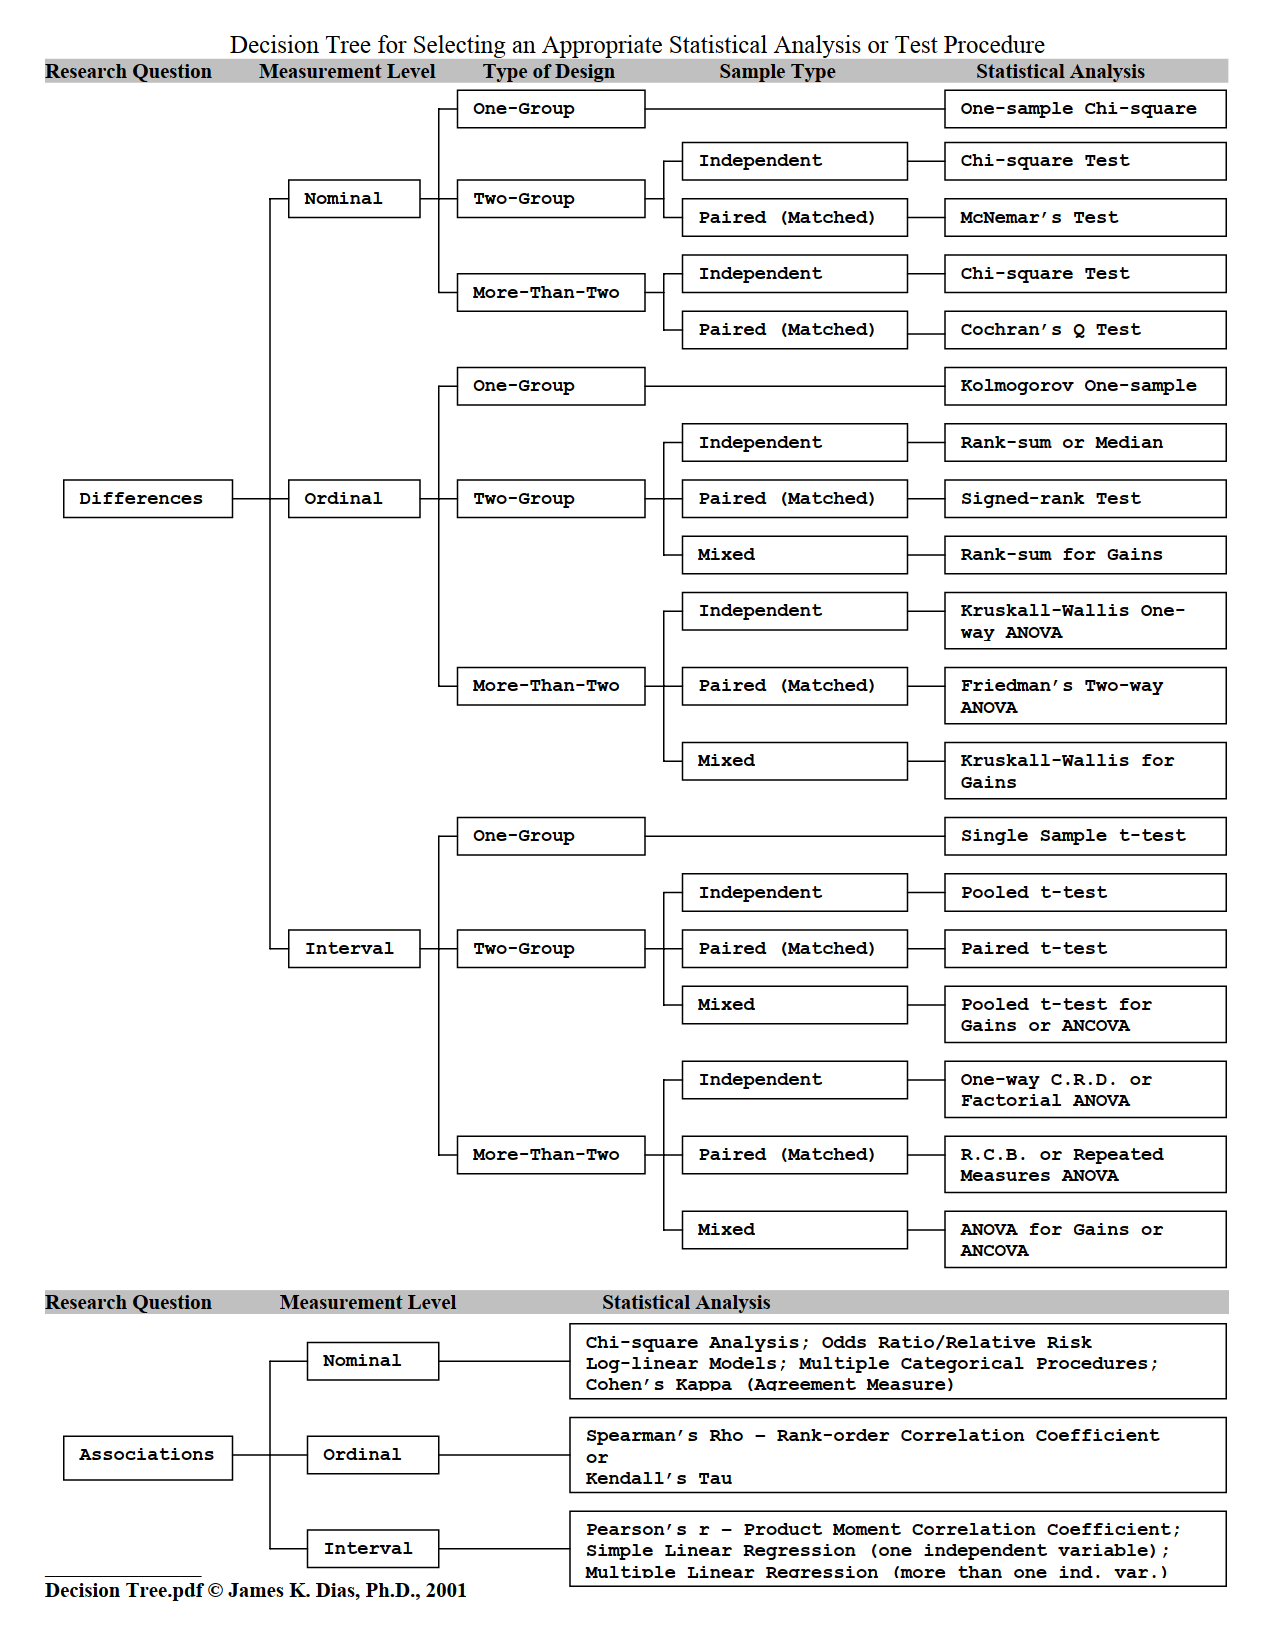
3. Online tools for selecting statistical procedures

Neal Van Eck.(2014). The Decision Tree for Statistics. Retrieved November 10, 2019, from : https://www.microsiris.com/Statistical%20Decision%20Tree/

http://www.simonqueenborough.info/R/intro/index.html
http://www.simonqueenborough.info/R/statistics/which-test.html
https://stats.idre.ucla.edu/other/mult-pkg/whatstat/
| Number of Dependent Variables | Nature of Independent Variables | Nature of Dependent Variable(s)* | Test(s) | How to SAS | How to Stata | How to SPSS | How to R |
|---|---|---|---|---|---|---|---|
| 1 | 0 IVs (1 population) | interval & normal | one-sample t-test | SAS | Stata | SPSS | R |
| ordinal or interval | one-sample median | SAS | Stata | SPSS | R | ||
| categorical (2 categories) | binomial test | SAS | Stata | SPSS | R | ||
| categorical | Chi-square goodness-of-fit | SAS | Stata | SPSS | R | ||
| 1 IV with 2 levels (independent groups) | interval & normal | 2 independent sample t-test | SAS | Stata | SPSS | R | |
| ordinal or interval | Wilcoxon-Mann Whitney test | SAS | Stata | SPSS | R | ||
| categorical | Chi-square test | SAS | Stata | SPSS | R | ||
| Fisher’s exact test | SAS | Stata | SPSS | R | |||
| 1 IV with 2 or more levels (independent groups) | interval & normal | one-way ANOVA | SAS | Stata | SPSS | R | |
| ordinal or interval | Kruskal Wallis | SAS | Stata | SPSS | R | ||
| categorical | Chi-square test | SAS | Stata | SPSS | R | ||
| 1 IV with 2 levels (dependent/matched groups) | interval & normal | paired t-test | SAS | Stata | SPSS | R | |
| ordinal or interval | Wilcoxon signed ranks test | SAS | Stata | SPSS | R | ||
| categorical | McNemar | SAS | Stata | SPSS | R | ||
| 1 IV with 2 or more levels (dependent/matched groups) | interval & normal | one-way repeated measures ANOVA | SAS | Stata | SPSS | R | |
| ordinal or interval | Friedman test | SAS | Stata | SPSS | R | ||
| categorical (2 categories) | repeated measures logistic regression | SAS | Stata | SPSS | R | ||
| 2 or more IVs (independent groups) | interval & normal | factorial ANOVA | SAS | Stata | SPSS | R | |
| ordinal or interval | ordered logistic regression | SAS | Stata | SPSS | R | ||
| categorical (2 categories) | factorial logistic regression | SAS | Stata | SPSS | R | ||
| 1 interval IV | interval & normal | correlation | SAS | Stata | SPSS | R | |
| interval & normal | simple linear regression | SAS | Stata | SPSS | R | ||
| ordinal or interval | non-parametric correlation | SAS | Stata | SPSS | R | ||
| categorical | simple logistic regression | SAS | Stata | SPSS | R | ||
| 1 or more interval IVs and/or 1 or more categorical IVs | interval & normal | multiple regression | SAS | Stata | SPSS | R | |
| analysis of covariance | SAS | Stata | SPSS | R | |||
| categorical | multiple logistic regression | SAS | Stata | SPSS | R | ||
| discriminant analysis | SAS | Stata | SPSS | R | |||
| 2+ | 1 IV with 2 or more levels (independent groups) | interval & normal | one-way MANOVA | SAS | Stata | SPSS | R |
| 2+ | interval & normal | multivariate multiple linear regression | SAS | Stata | SPSS | R | |
| 0 | interval & normal | factor analysis | SAS | Stata | SPSS | R | |
| 2 sets of 2+ | 0 | interval & normal | canonical correlation | SAS | Stata | SPSS | R |
- 文章信息
- 作者: kaiwu
- 点击数:666
Max Roser (2019) - "Tourism". Published online at OurWorldInData.org. Retrieved from: 'https://ourworldindata.org/tourism' [Online Resource]
The map shows the number of tourists by country. France is today the country that receives most tourists.
- 文章信息
- 作者: kaiwu
- 点击数:1096

Wallwork, A. (2013b). English for Academic Research: Vocabulary Exercises. Springer-Verlag.
Wallwork, A. (2013c). English for Academic Research: Writing Exercises. Springer-Verlag.
Wallwork, A. (2016a). English for Academic Correspondence. Springer-Verlag.
Wallwork, A. (2016b). English for Academic Research: A Guide for Teachers. Springer-Verlag.
Wallwork, A. (2016c). English for Interacting on Campus. Springer-Verlag.
Wallwork, A. (2016d). English for Presentations at International Conferences. Springer-Verlag.
Wallwork, A. (2016e). English for Writing Research Papers. Springer-Verlag.
Wallwork, A. (2019). English for Academic CVs, Resumes, and Online Profiles. Springer-Verlag.
Wallwork, A., & Southern, A. (2020). 100 Tips to Avoid Mistakes in Academic Writing and Presenting. Springer-Verlag.


