
2024-05-15
1.1questionnaire
![]() http://kaiwu.city/openfiles/tourist_satisfaction_questionnaire_cn.pdf
http://kaiwu.city/openfiles/tourist_satisfaction_questionnaire_cn.pdf
 http://kaiwu.city/openfiles/data_tourist_cn.sav
 http://kaiwu.city/openfiles/analysis_tourist_cn.sps
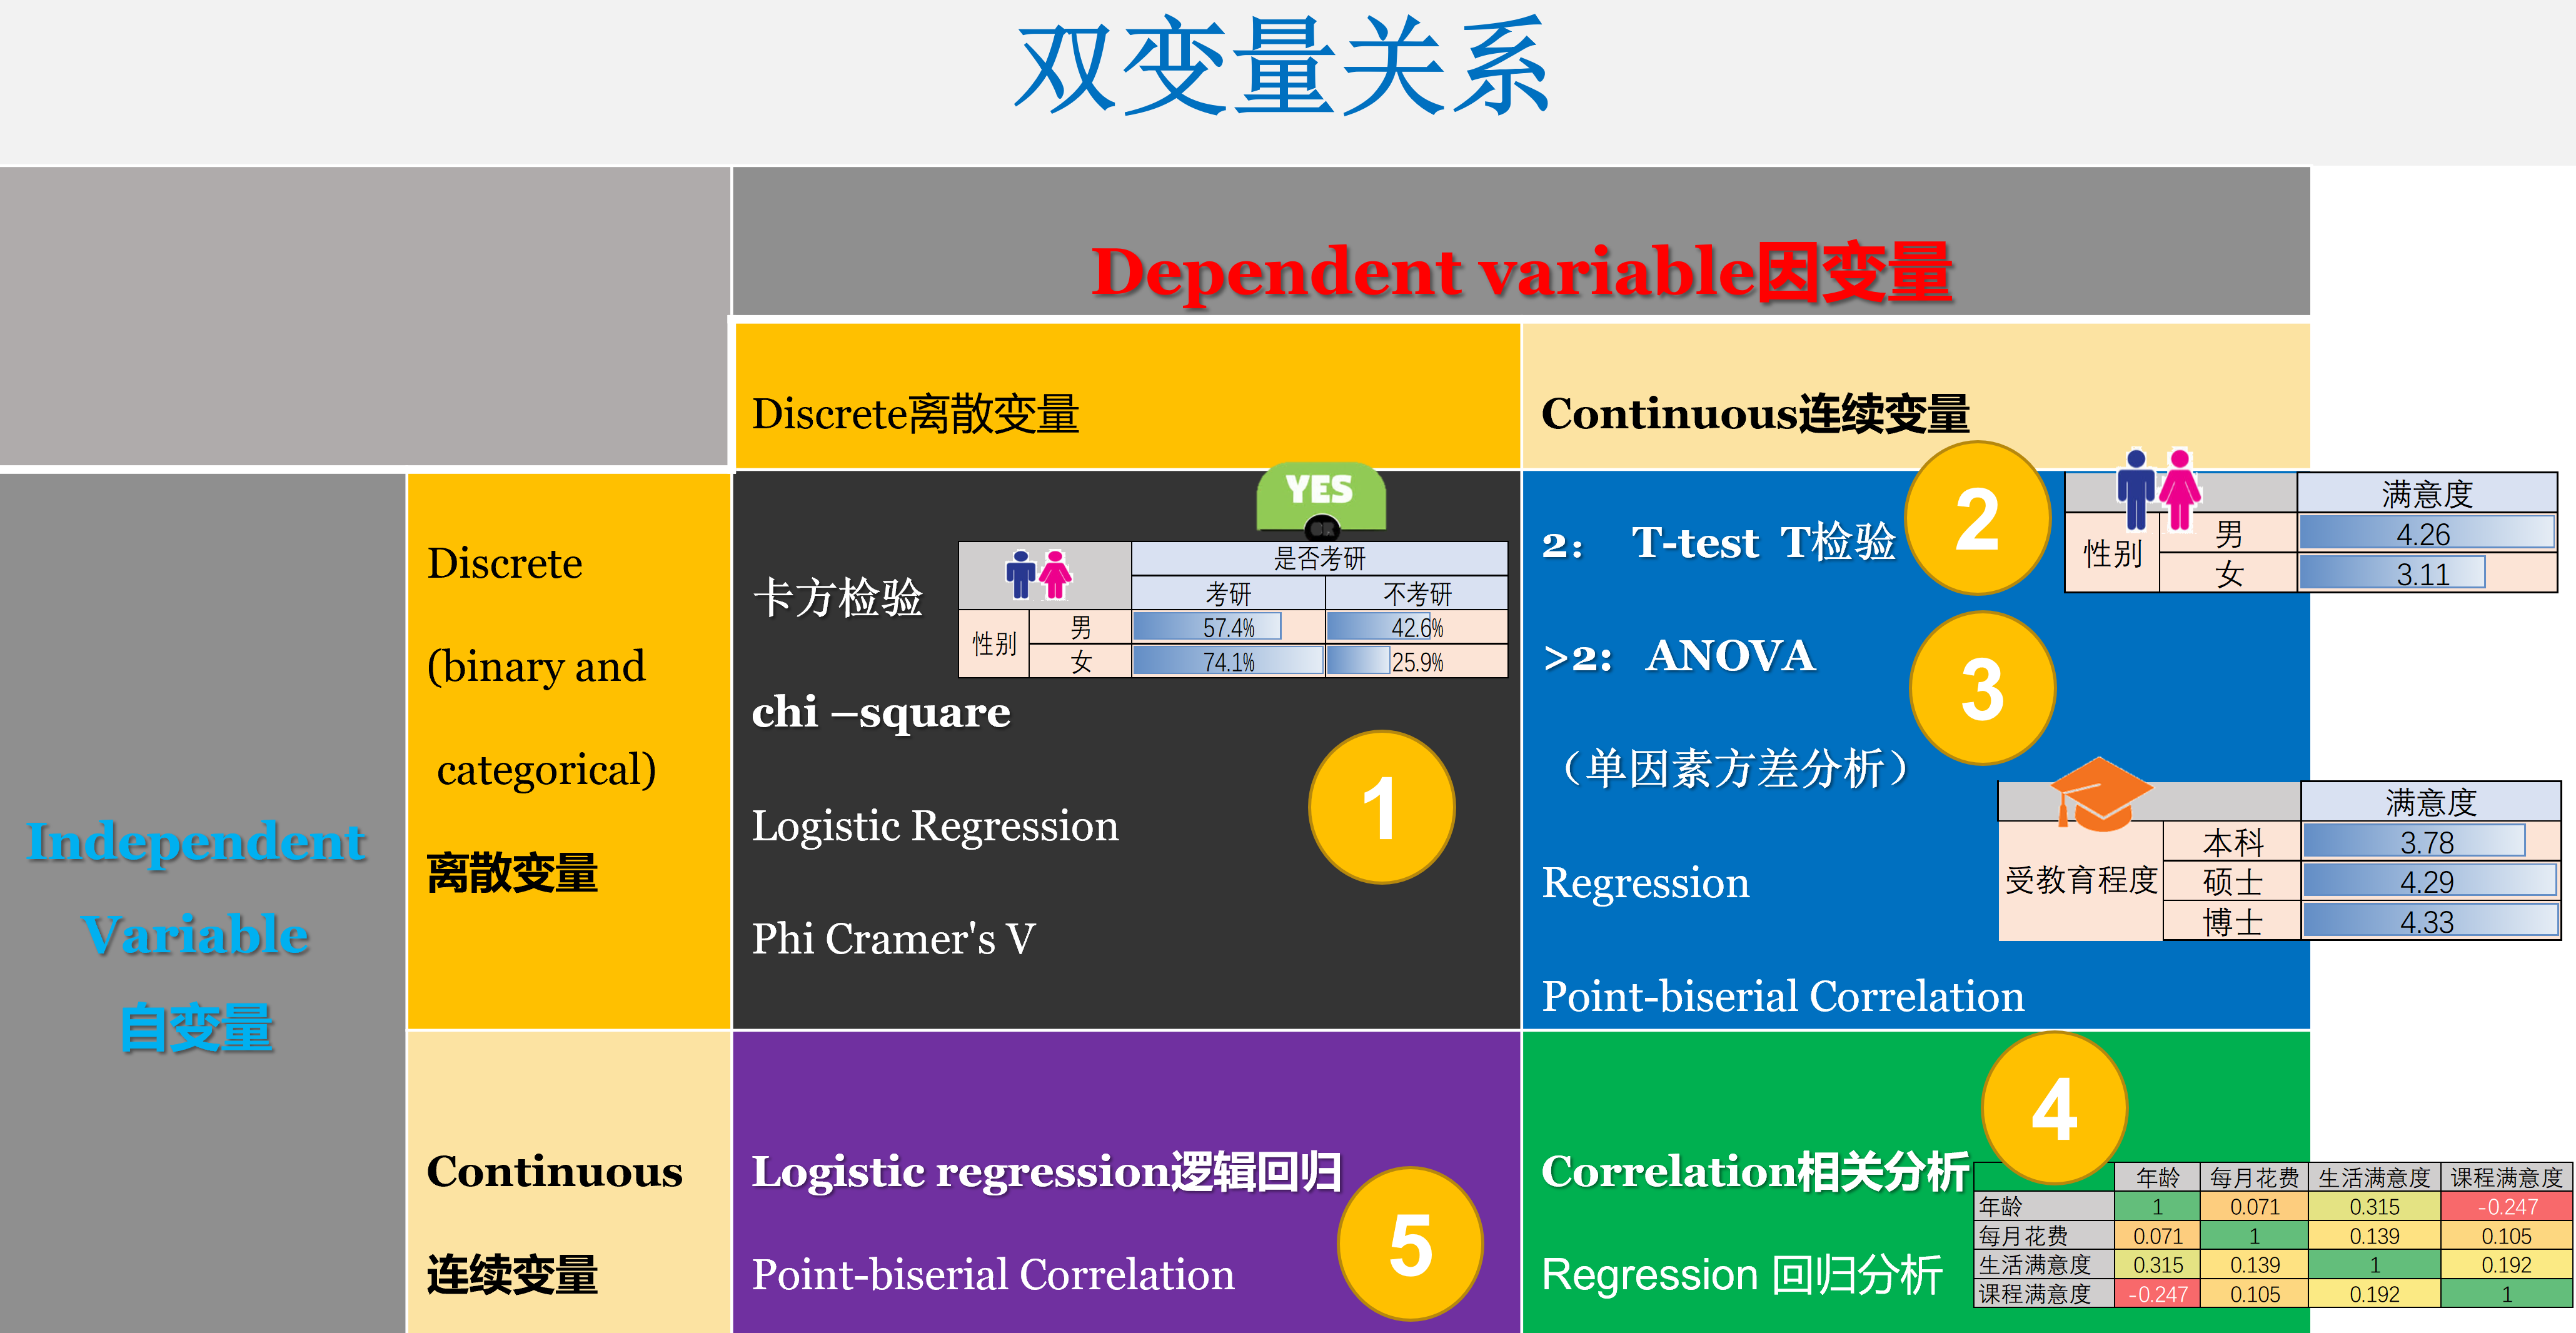
4.两个变量之间的关系relationship between two variables
types of variables (level of measurment)
https://statistics.laerd.com/statistical-guides/types-of-variable.php
https://www.thoughtco.com/independent-and-dependent-variable-examples-606828
https://datatab.net/tutorial/level-of-measurement
4.1 卡方检验chi-square test
2023-11-21
![]() http://kaiwu.city/openfiles/tourist_CN.zip
http://kaiwu.city/openfiles/tourist_CN.zip
http://kaiwu.city/index.php/analysis-using-excel
VBA
 http://kaiwu.city/openfiles/Excel_VBA_example.xlsm
![]()
http://kaiwu.city/index.php/spss-and-pspp
how to choose statistical procedures.
http://kaiwu.city/index.php/statistical-map
SPSS相关书籍
books on SPSS:https://www.douban.com/doulist/45508075/
- Collier, J. (2009). Using SPSS Syntax: A Beginner’s Guide. SAGE.
- Coolican, H. (2019). Research Methods and Statistics in Psychology (7th). Routledge.
- Dancey, C. P., & Reidy, J. (2020). Statistics Without Maths for Psychology (8th). Pearson.
- Field, A. (2009). Discovering Statistics Using SPSS (3rd). SAGE.
- Field, A. (2017). Discovering Statistics Using IBM SPSS Statistics (5th). SAGE.
- George, D., & Mallery, P. (2022). IBM SPSS Statistics 27 Step by Step: A Simple Guide and Reference (17th). Routledge.
- Harrison, V., Kemp, R., Brace, N., & Snelgar, R. (2022). SPSS for Psychologists (7th). Bloomsbury Academic.
- Howitt, D., & Cramer, D. (2017). Understanding Statistics in Psychology with SPSS (7th). Pearson.
- Mesquita, J. M. C. de, & Kostelijk, E. (2022). Marketing Analytics: Statistical Tools for Marketing and Consumer Behaviour Using SPSS. Routledge.
- Otieno Okello, G. (2023). Simplified Business Statistics Using SPSS. CRC Press.
- Roni, S. M., & Djajadikerta, H. G. (2021). Data Analysis with SPSS for Survey-based Research. Springer.
- Sarstedt, M., & Mooi, E. (2019). A Concise Guide to Market Research: The Process, Data, and Methods Using IBM SPSS Statistics (3rd). Springer.
- Singh Kaurav, R. P., Gursoy, D., & Chowdhary, N. (2021). An SPSS Guide for Tourism, Hospitality and Events Researchers. Routledge.
- Verma, J. P. (2016). Sports Research with Analytical Solution using SPSS . Wiley.
- 郭志刚. (2015). 社会统计分析方法: SPSS软件应用. 中国人民大学出版社
-
吴明隆. (2010). 问卷统计分析实务:SPSS操作与应用. 重庆大学出版社.
- 张文彤. (2002a). 世界优秀统计工具SPSS11.0统计分析教程(基础篇). 北京希望电子出版社.
- 张文彤. (2002b). 世界优秀统计工具SPSS11.0统计分析教程(高级篇). 北京希望电子出版社.

http://kaiwu.city/index.php/jamovi
![]()
The jamovi project (2021). jamovi (Version 1.6) [Computer Software]. Retrieved from https://www.jamovi.org
official website:https://www.jamovi.org/
Github: https://github.com/jamovi
softpededia:https://www.softpedia.com/get/Science-CAD/jamovi.shtml
jamovi is a free, open-source data analysis application that bridges the gap between the freedom and power of R and the accessibility of SPSS.
jamovi是一个开源免费、操作简单的统计分析软件,兼容R软件,替代SPSS等软件。
下列关于jamovi的简介来自http://www.obhrm.net/index.php/Jamovi
jamovi是在R语言基础上开发出来的免费开源统计分析软件,其操作与界面与SPSS非常相似。jamovi的特点如下:
1、开源软件。jamovi属于开源软件,全球任何人均可以下载使用,用jamovi进行统计分析,是免费用正版软件进行统计分析。
2、轻巧型软件。Windows版jamovi程序总共不到250M,属于特别轻巧的统计分析程序。
3、操作简单、方便。jamovi的操作界面类似于SPSS,使用非常方便。
4、保存结果的同时保存分析过程。他人在拿到结果的同时,能看到分析的过程,并重现所有的分析过程。
5、可以进行多种统计分析。jamovi本身包括t检验、ANOVA, 相关与回归分析,因子分析(包括探索性因子分析与验证性因子分析)等基本统计分析,是本科生与硕士研究生学习统计分析的极佳工具。
6、可扩充性。jamovi可以加载模块(Modules),加载(Modules)后可以实现更多的统计分析,包括元分析、功效分析(Power analysis)、中介与调节模型分析、贝叶斯方法等。
7、动态生成报告。在统计分析时,动态呈现对应的统计分析结果。
8、自动生成三横线表格,可以直接复制粘贴到WORD和Excel中,稍加编辑就是可用来报告的表格。
9、与R无缝对接。加载Rj模块后,可以在jamovi中用R进行统计分析;jamovi在R中有一个包 - jmv,加载该包,可以在R中运行并实现jamovi的全部功能。jmv包的网址:https://cran.r-project.org/web/packages/jmv/index.html
1.关于示例数据集 (tourist satisfaction)

1.1questionnaire
![]() http://kaiwu.city/openfiles/tourist_satisfaction_questionnaire_cn.pdf
http://kaiwu.city/openfiles/tourist_satisfaction_questionnaire_cn.pdf
1.2 通用数据格式 (没有 variable labels变量名标签和 value labels变量值标签)
 http://kaiwu.city/openfiles/tourist.csv
或
http://kaiwu.city/openfiles/data_tourist_satisfaction_cn.xlsx
2.数据准备data preparation (data cleaning or data wrangling)
2.1 导入数据
https://libguides.library.kent.edu/SPSS/ImportData
http://kaiwu.city/openfiles/data_tourist_cn.sav
2.2 数据管理
https://libguides.library.kent.edu/SPSS/data-management
syntax file: add variable labels, value labels, compute variables and recode variables.
syntax:中文标签
http://kaiwu.city/openfiles/labels_tourist_CN.sps
syntax:英文标签
http://kaiwu.city/openfiles/labels_tourist_satisfaction_en.sps
使用这2个SPSS syntax程序,可以快速切换变量名标签(variable labels)、变量值标签(value labels)的语言:英文、中文
http://kaiwu.city/openfiles/data_tourist_cn.sav
3.基本分析
http://kaiwu.city/openfiles/analysis_tourist_cn.sps
 http://kaiwu.city/openfiles/academic_report_SPSS_CN.docx
Kent State University Libraries. (2017, May 15). SPSS tutorials: Independent samples t test. Retrieved May 17, 2017, from http://libguides.library.kent.edu/SPSS/IndependentTTest
3.1 频数分析frequency Analysis(分类变量)
https://libguides.library.kent.edu/SPSS/FrequenciesCategorical
https://www.spss-tutorials.com/spss-frequencies-command/
https://datatab.net/tutorial/frequency-table
中文参考
https://zhuanlan.zhihu.com/p/108860781
3.2 列联表分析cross-table(分类变量)
https://libguides.library.kent.edu/SPSS/Crosstabs
中文参考
https://zhuanlan.zhihu.com/p/634975678
3.3 描述性统计分析Descriptive analysis(数值变量)
https://libguides.library.kent.edu/SPSS/Descriptives
https://www.spss-tutorials.com/spss-descriptives-command/
中文参考
https://blog.csdn.net/qq_42278015/article/details/119696576
3.4 自定义表格custom table(值得高度关注)
https://www.ibm.com/docs/en/spss-statistics/saas?topic=statistics-custom-tables
中文参考(本站)
http://kaiwu.city/index.php/spss-custom-table-cn
4.两个变量之间的关系relationship between two variables
types of variables (level of measurment)
https://statistics.laerd.com/statistical-guides/types-of-variable.php
https://www.thoughtco.com/independent-and-dependent-variable-examples-606828
https://datatab.net/tutorial/level-of-measurement
4.1 卡方检验chi-square test
https://libguides.library.kent.edu/SPSS/ChiSquare
https://datatab.net/tutorial/chi-square-test
4.2 独立样本T检验independent sample t-test
https://libguides.library.kent.edu/SPSS/IndependentTTest
https://datatab.net/tutorial/unpaired-t-test
中文参考
https://blog.csdn.net/qq_51843109/article/details/123612791
4.3 单因素方差分析ANOVA
https://libguides.library.kent.edu/SPSS/OneWayANOVA
https://datatab.net/tutorial/anova
中文参考
https://zhuanlan.zhihu.com/p/448983174
4.4 相关分析correlation
https://libguides.library.kent.edu/SPSS/PearsonCorr
https://datatab.net/tutorial/correlation
中文参考
https://blog.csdn.net/nekonekoboom/article/details/116708114
4.5 逻辑回归分析logistic regression
https://www.spss-tutorials.com/logistic-regression/
https://datatab.net/tutorial/logistic-regression
中文参考
https://zhuanlan.zhihu.com/p/340480145
5.量表分析analysis for scales (measurement)
5.1 信度分析reliability analysis
https://www.spss-tutorials.com/cronbachs-alpha-in-spss/
https://www.spss-tutorials.com/spss-split-half-reliability/
https://datatab.net/tutorial/cronbachs-alpha
中文参考
https://www.zhihu.com/tardis/zm/art/270005975
5.2 探索性因子分析(用于效度分析)exploratory factor analysis (EFA)
https://www.spss-tutorials.com/spss-factor-analysis-tutorial/
https://www.spss-tutorials.com/spss-factor-analysis-intermediate-tutorial/
https://www.spss-tutorials.com/apa-reporting-factor-analysis/
https://datatab.net/tutorial/exploratory-factor-analysis
中文参考
https://www.zhihu.com/tardis/zm/art/270005975
6.输出分析结果export result
https://www.spss-tutorials.com/spss-output/
https://www.spss-tutorials.com/spss-apa-format-descriptives-tables/
中文参考
https://spss.mairuan.com/jiqiao/spss-wuxja.html